Tabellum for mobile · Chapter 5
Charts, dashboards and export
5.1 Charts#
Any result can be a chart: tap the chart button in the bar under the result. Tabellum suggests one from the columns; change the kind 1, the column along x 2 and the series to taste. 3 saves the chart as PNG or SVG.
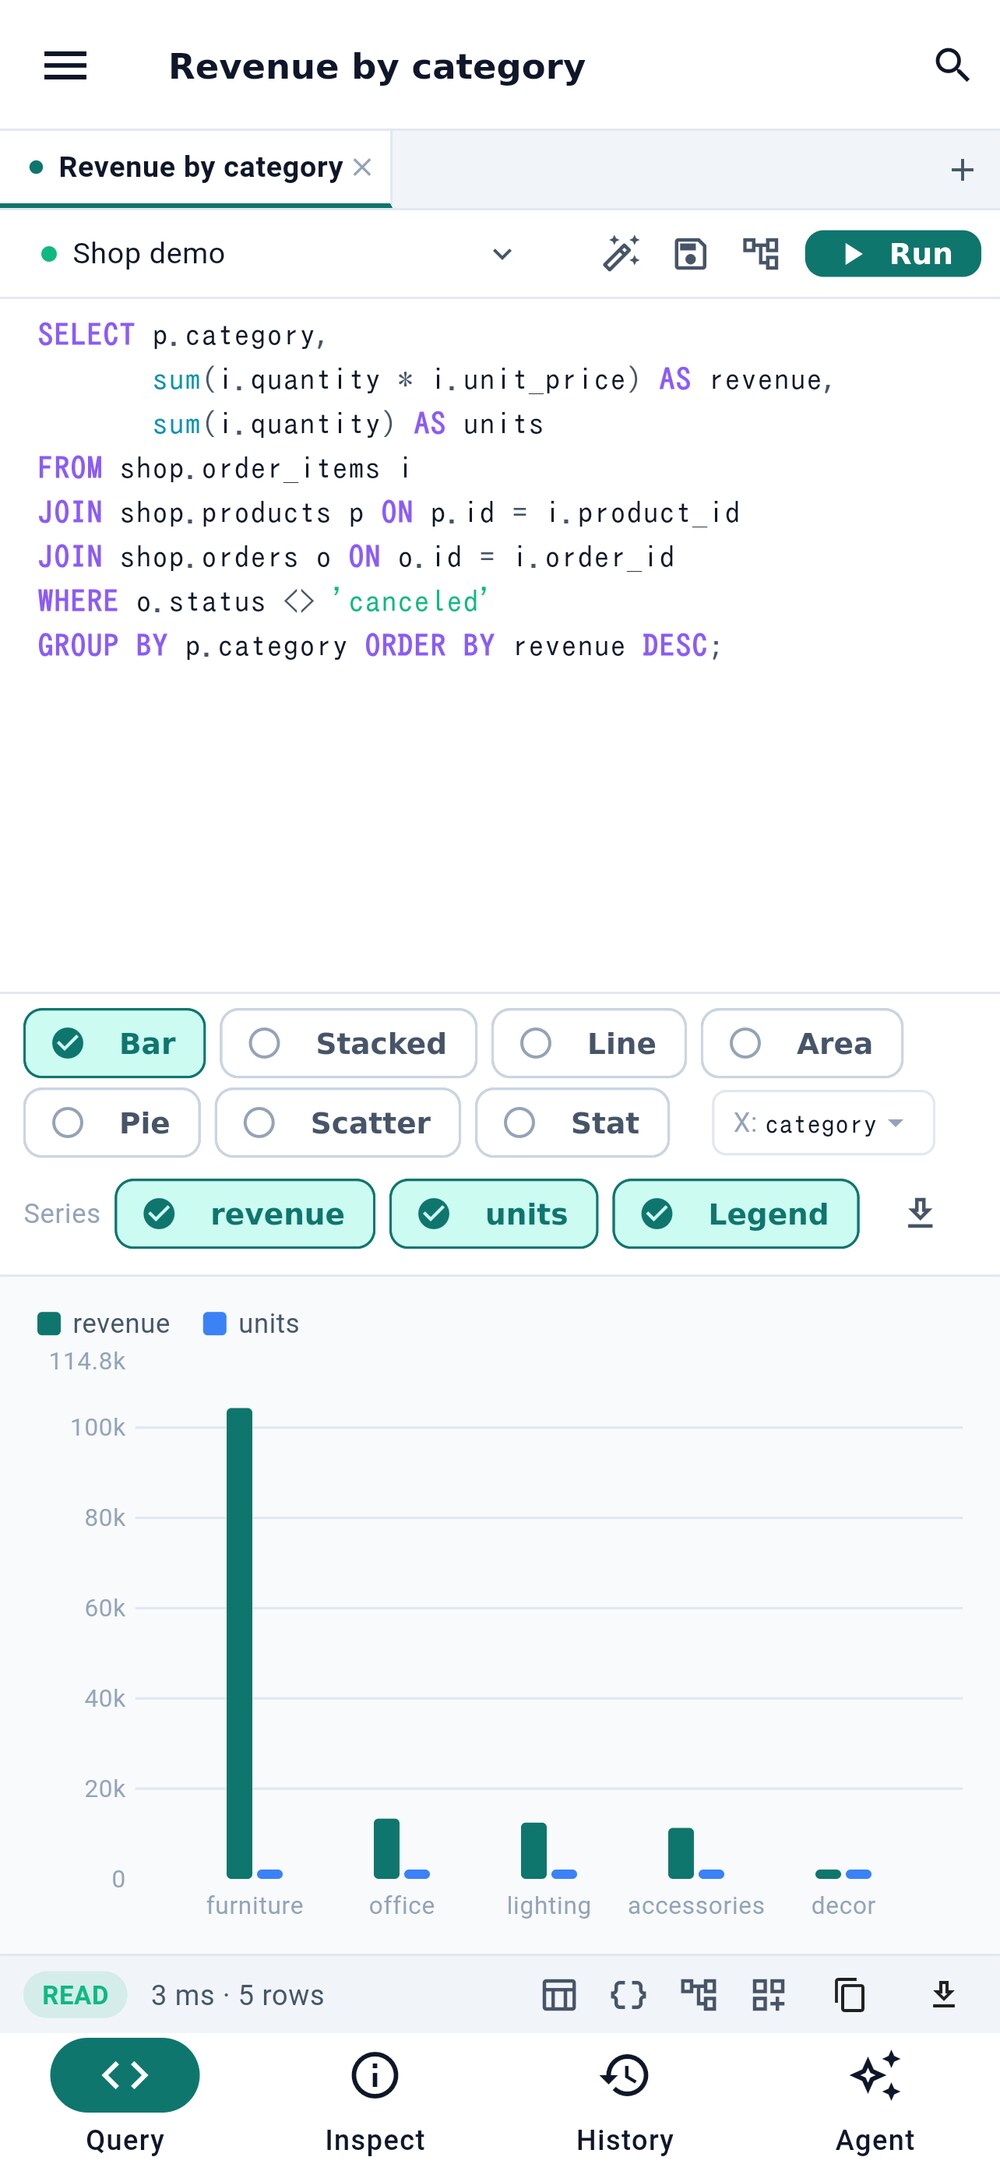
- The kind of chart
- The column along x
- Save as PNG or SVG
The kinds are bar, stacked bar, line, area, pie, scatter and stat (one big number). A line or area over dates or numbers is drawn in their order, not the rows’ order.
5.2 Dashboards#
A dashboard is a page of panels — charts and tables — each with its own query, on any connection. It lives as a file in dashboards/; on a phone its panels stack in one column.
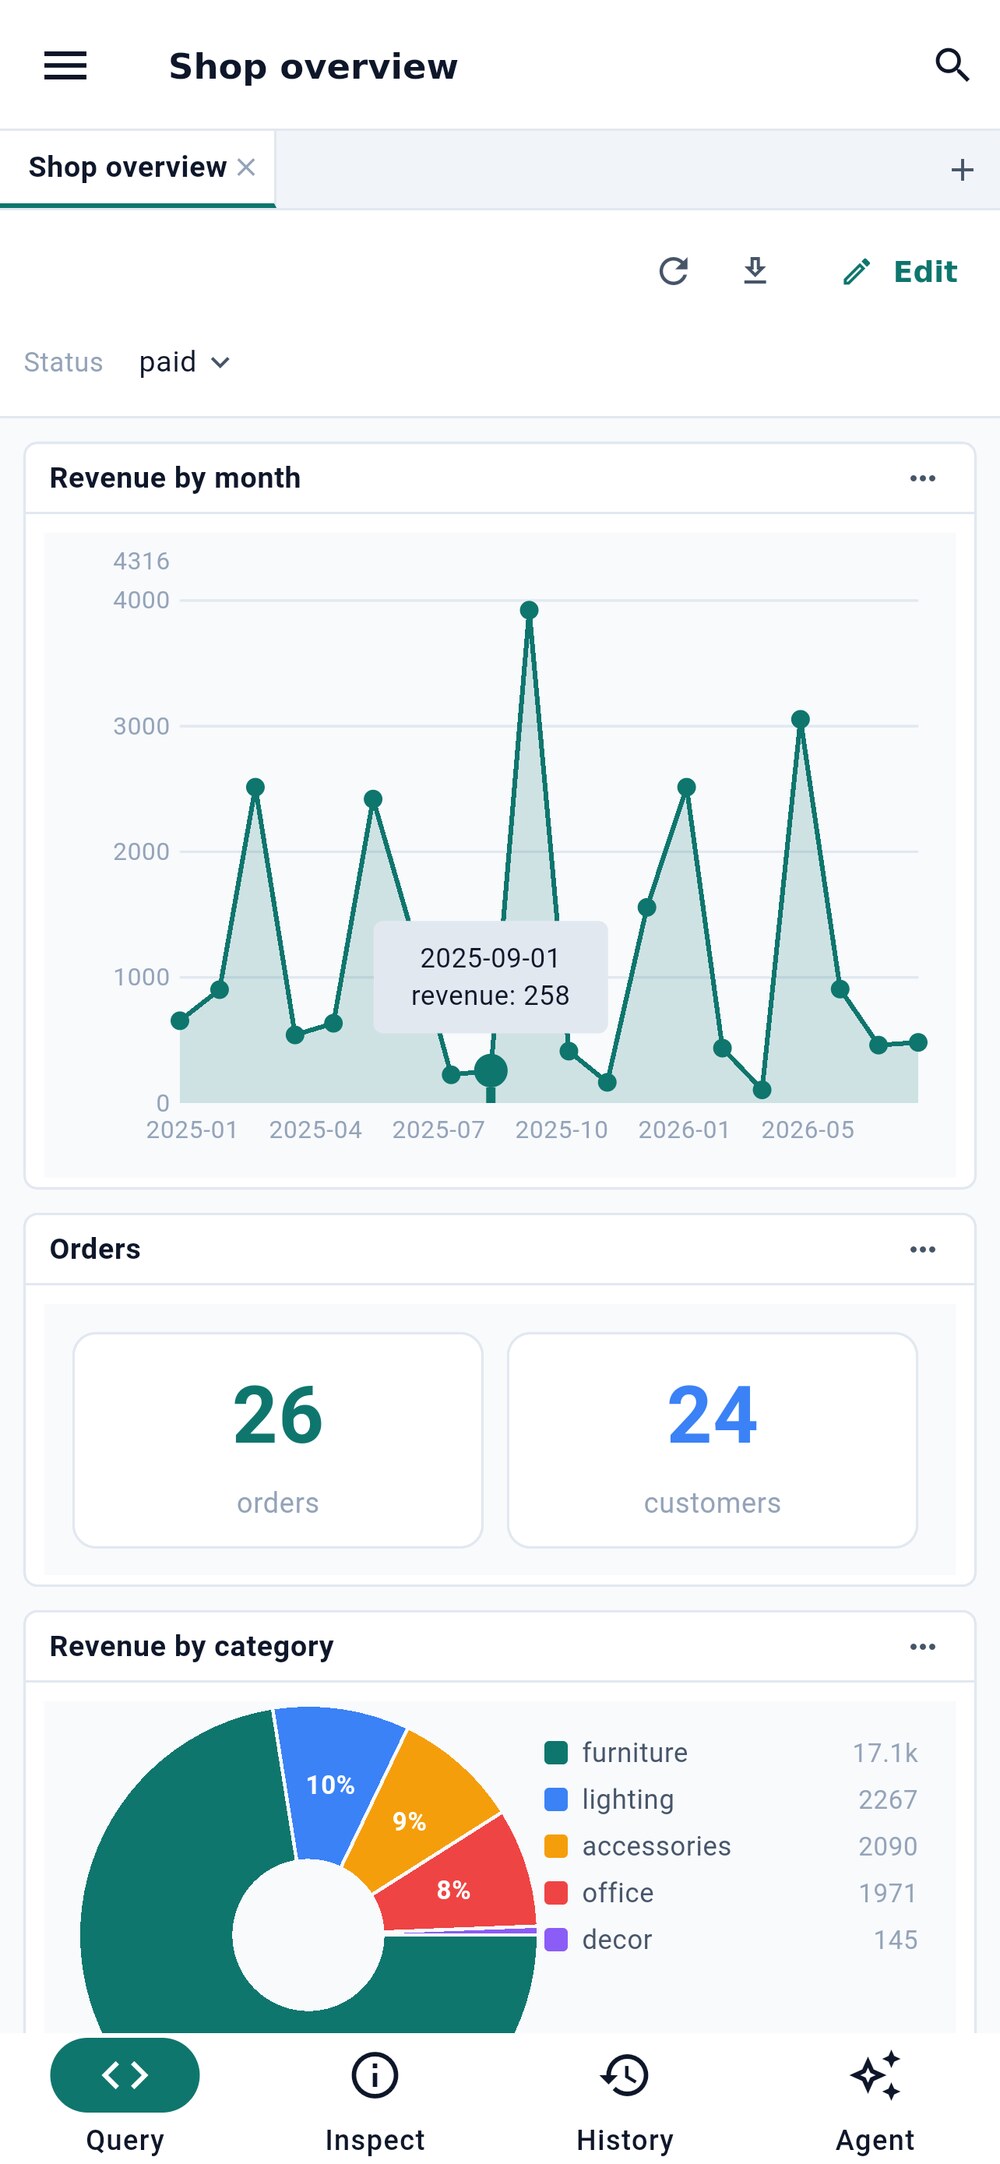
- A parameter every panel uses
- Refresh every panel
- Export as PNG or PDF
- Edit panels and parameters
- Parameters 1 are shared by every panel: change one and they all run again.
- 2 refreshes every panel; a panel can also rerun on its own timer while the dashboard is open.
- 3 exports the dashboard as a file, a PNG or a PDF.
- 4 edits the panels: their queries, their charts and their place on the grid.
To add a result you are looking at, use Add to dashboard… in the bar under it.
5.3 Exporting results#
The export button under a result saves it as CSV, JSON, SQL INSERT statements or an Excel workbook (a large result is split across sheets). The copy menu copies a cell, a row as JSON, a column, the column names, or the whole result as CSV, JSON or SQL.
To export a whole table, schema or database, long-press it in the menu; Import into table… in a table’s menu loads a CSV or JSON Lines file into it, in one transaction.